The students in my Political Science Senior Seminar conducted a survey to investigate the beliefs and attitudes of Luther College students. Below are the results they wanted to share about religiosity on campus.  Analysis of Data In order to see how Luther has affected its students’ religiosity, NORP asked the students at Luther to take a survey that would classify their previous and current religious identity. In total, 222 Luther students responded to our survey. Each student was asked how religious they believe they were before they started at Luther and how religious they believe they are now, as well as what religious group they belong to before Luther and what religious group do they currently belong. Whether it was before their time at Luther or currently, most students responded that they practiced either Protestantism, Catholicism, or no religion at all. Number of Participants 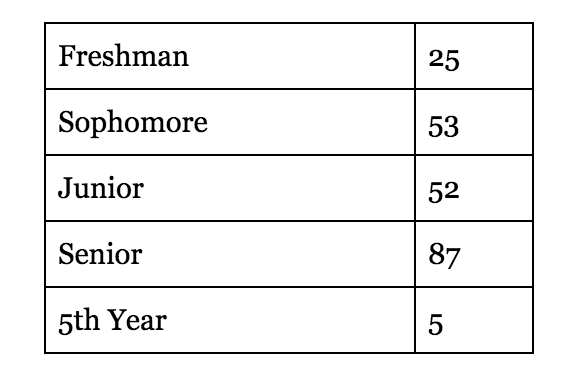 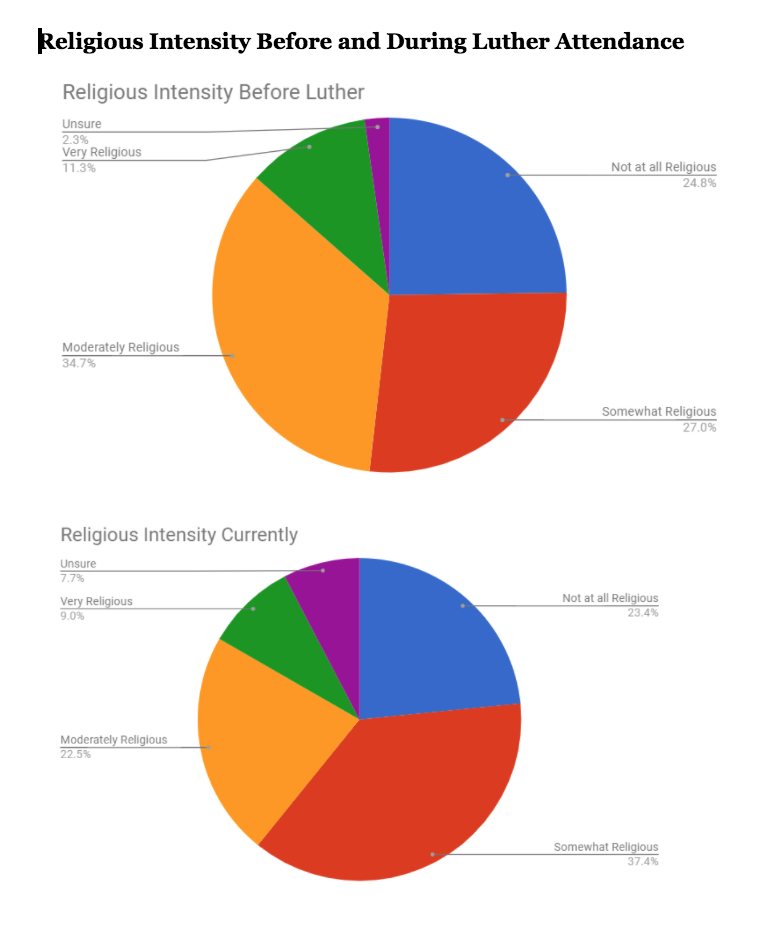 The biggest changes were in the “Moderately Religious Category”, which formerly comprised over a third of incoming Luther students but now is less than a quarter of Luther students. Additionally, there has been an overall 5% increase in students who are unsure of their religious intensity before coming to Luther, and an overall 10% increase in students who identify as “Somewhat Religious”. Technically, less students identify with having no religious intensity. 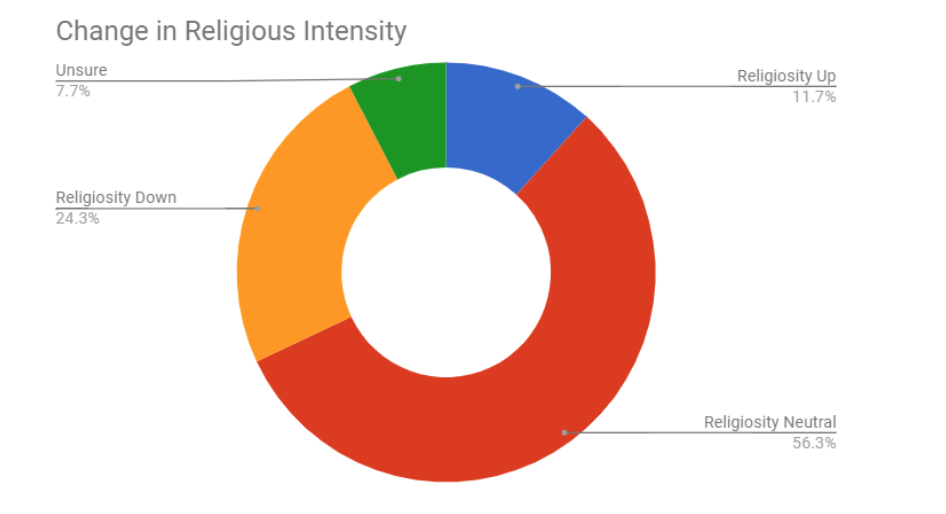 This chart demonstrates the percentages of ‘trends’, or the number of students whose religiosity increased, decreased, stayed the same, or has become unsure. According to these results, about one fourth of student’s religious intensity has decreased since coming to Luther, while only around one tenth of students’ religious intensity has increased. However, over half of students have experienced no change in their religious intensity, meaning that Luther is (technically) more likely to NOT affect your religious intensity. 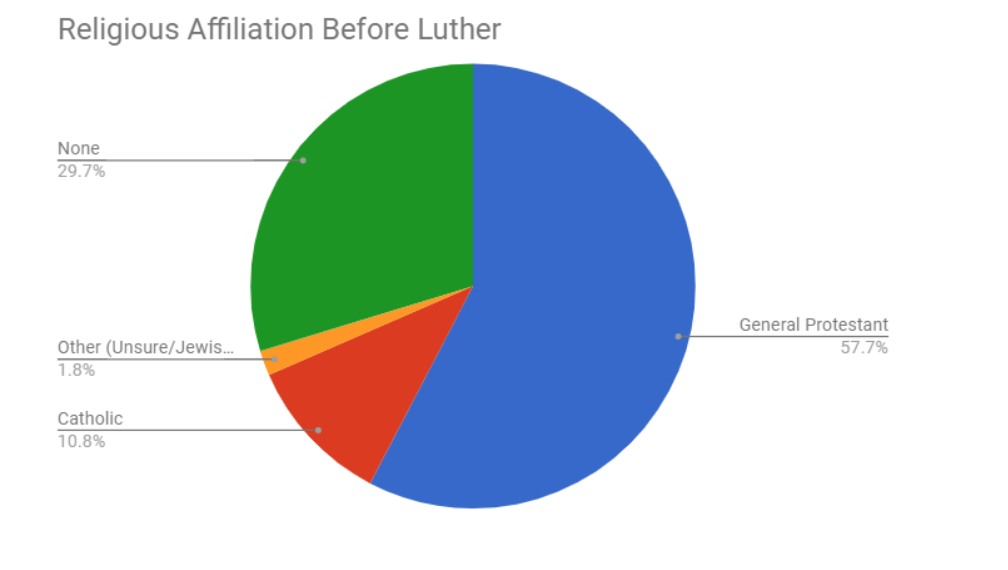 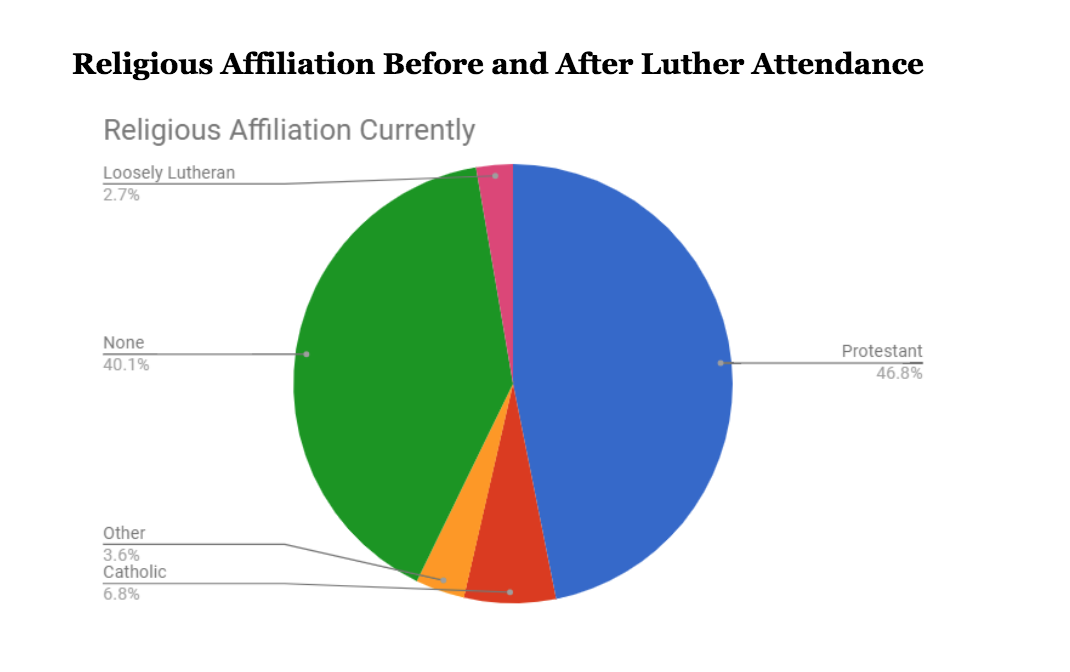 While Luther has an ambiguous impact on religious affiliation (while there is a correlation that half of Luther Students will alter their religious intensity), there is an undeniable trend of Luther moving students away from affiliating themselves with a religion. There has been a definitive jump of affiliating oneself with NO religious tradition, and a decrease in students who align themselves with Protestantism and Catholicism. There is very little representation of Hindu, Buddhist, and Jewish students. In fact, of the two Jewish students coming into Luther, only one has maintained that part of their identity. However, zero students were Buddhist before coming into Luther, with two currently affiliating themselves with the religion (one a Pureland Buddhist, and the other a Christian Buddhist). The sole Hindu respondent has maintained their affiliation.
Findings Among other things, we were able to conclude that only 9% of students at Luther are very religious while 25% of students reported that they have experienced a loss in religious beliefs and practices since coming to Luther. According to Luther’s Mission Statement, Luther College is a college of the church. However, according to our findings, it appears as though it is more likely for a student to be less religious or not religious at all after attending Luther College. As an ELCA affiliated school, do you feel that Luther should be taking more steps to provide more religious structure in Luther’s academics? Feel free to tell us what you think about the survey or this question in the comments below. As always, thank you to those that participated in this survey! If you would like to know more about this survey or other surveys we have constructed throughout the semester please attend our seminar presentation this Thursday (November 16th) in Valders 262 at 5:30pm.
1 Comment
The students in my Senior Seminar course on Media and Politics conducted poll about student engagement at Luther College. Below are the results. Brief Analysis of Data Last month, NORP conducted an in-person survey about the level of involvement students at Luther have with various organizations, athletics, and musical groups. In total, 282 Luther students were surveyed, with samples from each grade and gender. In order to better compile our results, we developed three categories: student organizations (Greek Life, Student Senate, SAC, etc.), athletics, and musical ensembles. Each student that was surveyed was not only asked how many organizations, sports, or music ensembles they participate in, but they were also asked which particular group they spend the most time in and how many hours of their week they devote to each group. Hours Involved Means (average hours) Female: 9.23 hours involved Male: 10.34 hours involved Both: 9.60 hours involved Medians (middle number of hours when put in order from greatest to least) Female: 7 hours Male: 10 hours Both: 8 hours Modes (most common number of hours) Female: 10 hours Male: 2 hours Both: 10 hours 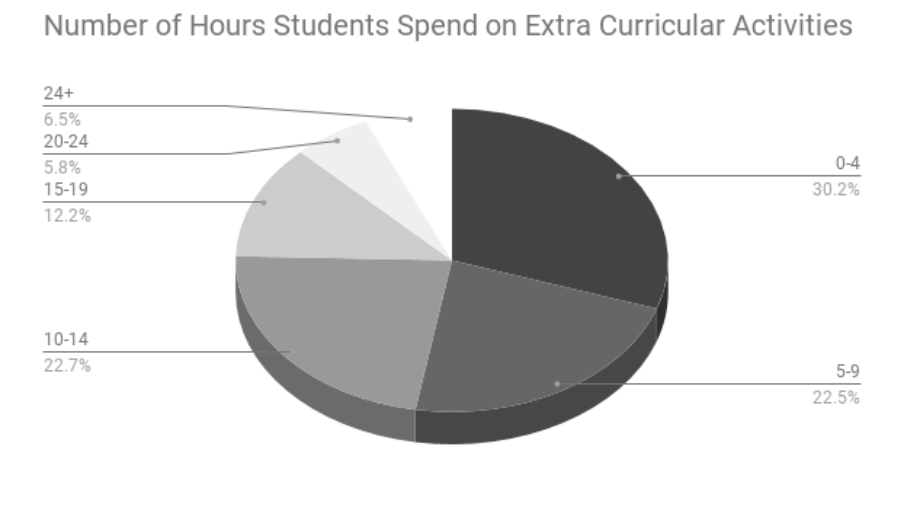 Activities Involved In Mean (average number of activities) Women: 2.843 activities Men: 2.843 activities Both: 2.807 activities Median: Women: 3 activities Men: 3 activities Both: 3 activities Mode: Women: 2 activities Men 2 activities Both: 2 activities 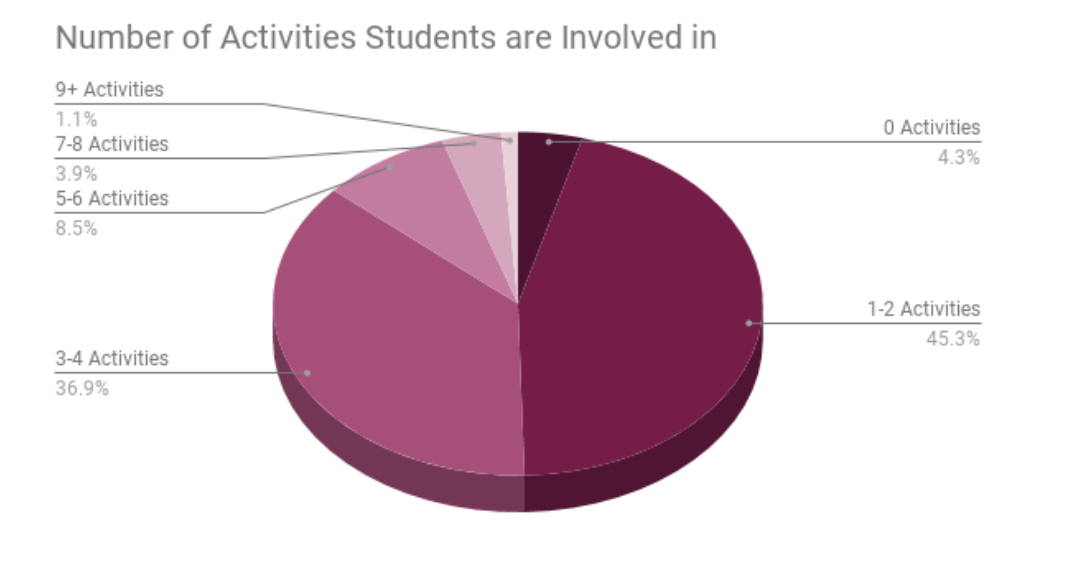 Breakdown of groups: Due to students being able to write down which activities they spend the most time in, some answers fell into more than one group. In the spirit of inclusivity, we have decided to mark students as mainly involved in more than one category. This means the percentages will NOT add up to 100 percent. Music: 104 students 36.76% Sports/Athletics: 73 students 26.80% Student orgs: 68 students 24.03% Average Hours involved in Extracurriculars The averages are calculated with the mean of the data, which is presented below: 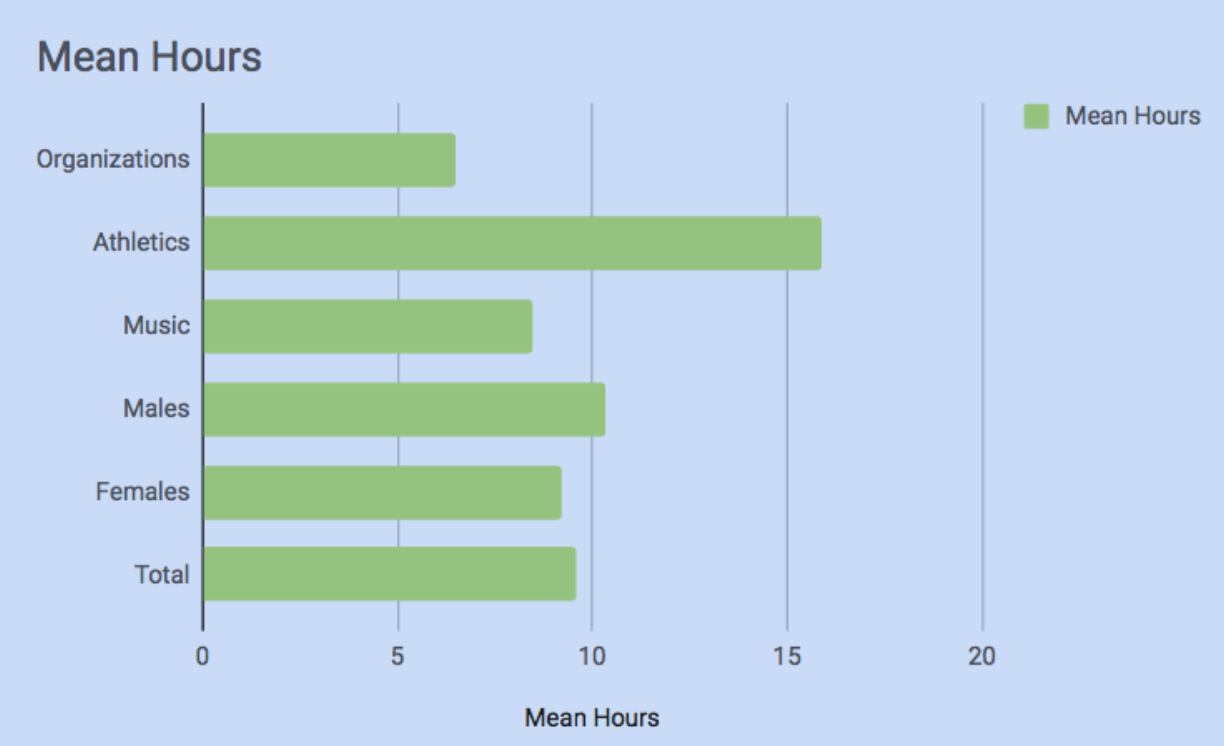 Average Mean based on Category: Total Mean- 9.6 hours Female Mean- 9.23 hours Male Mean- 10.34 hours Music Focused Mean- 8.48 hours Sport/Athletic Focused Mean- 15.86 hours Organization Focused Mean- 6.46 hours Average Hours involved in Extracurriculars The following data is calculated by finding the median, first quartile, and second quartile of the data: 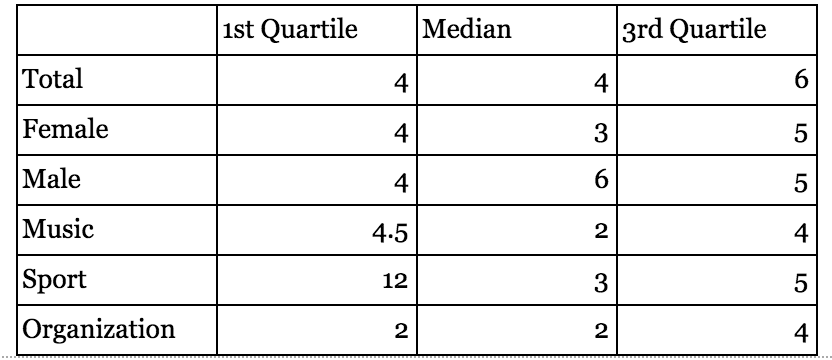 Findings:
Luther students pride themselves on their level of involvement in a variety of different student groups. We created this survey in order to find out if Luther students are as involved as they claim to be, which grade and/or gender is the most involved, and if there were changes in the levels of involvement between the freshman and senior years of college. There are a variety of ways to breakdown our findings and compare them with our sample groups to draw various conclusions about the level of involvement particular people at Luther have. For example, our findings show that more females are involved in music than males, however more males are involved in athletics compared to females. These results represent the information collected from our survey in the Cafeteria. Keep in mind that these numbers are not the exact numbers from all students currently attending Luther. These numbers are projections based off of our sample of over 10% of students. If you have any comments about the survey results or polling method, feel free to post your comments and questions on our Facebook page. Thank you to all of those that volunteered their time to fill out our survey! This year Luther College installed a blue turf on the college's football field. I saw some interesting discussions on Facebook about the blue turf, mostly by alumni. I was not sure, however, how the student population felt about it.  Brief Analysis of Data 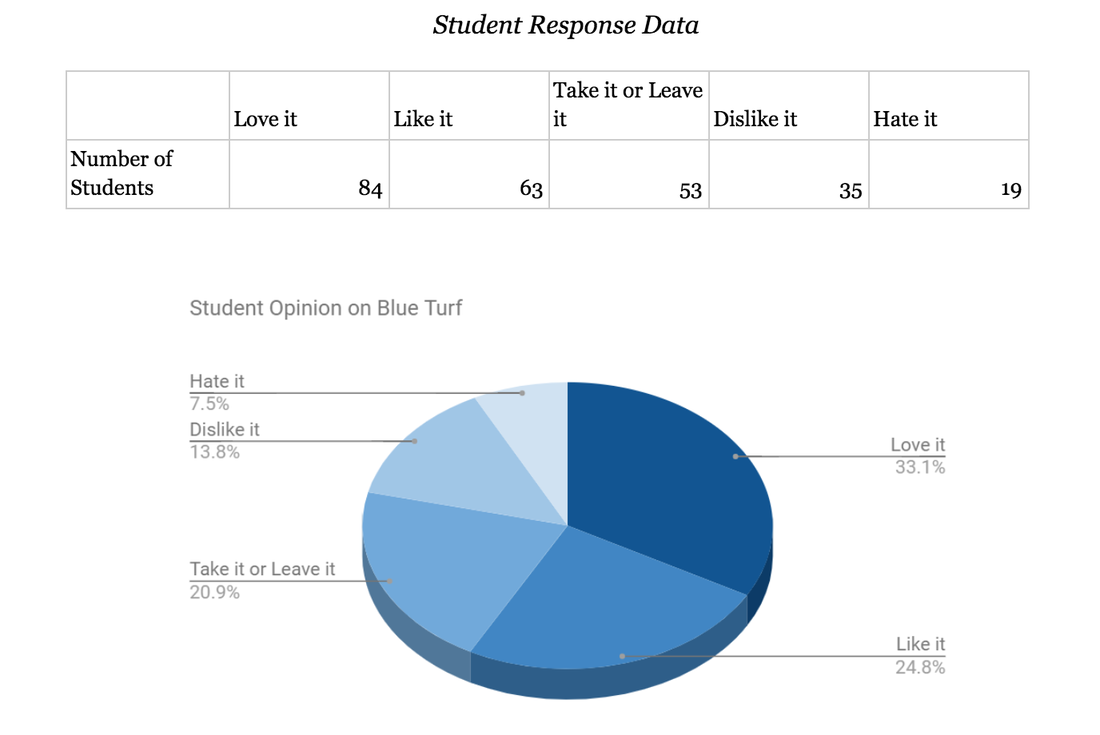 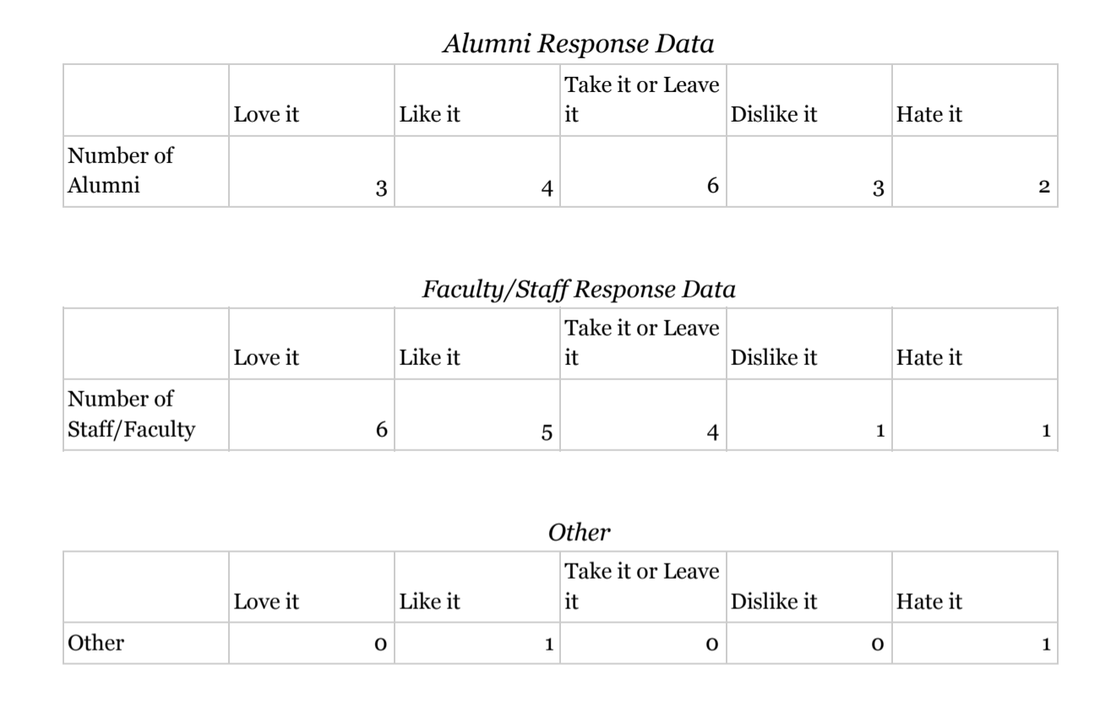 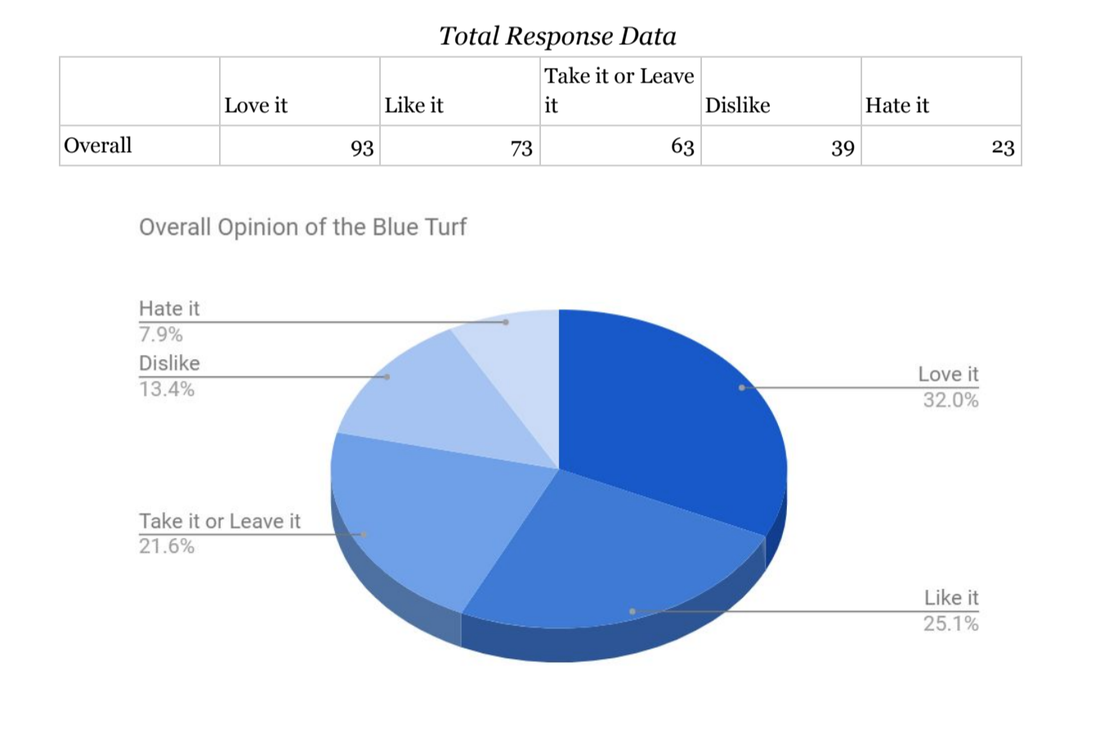 What is Margin of Error? Discussion and Analysis: Follow NORP on Facebook and Twitter |
Student WorkSharing student assignments that should reach more people than just me. Archives
April 2024
Categories
All
|
 RSS Feed
